3QFY2019 Result Update | Power
February 2, 2019
NTPC Ltd
BUY
CMP
`140
Performance Highlights
Target Price
`195
Investment Period
12 Months
(` cr)
3QFY19
2QFY19
% chg (qoq)
3QFY18
% chg (yoy)
Net revenue
24,120
22261
8.4
20774
16.1
Stock Info
EBITDA
6270
5592
12.1
5230
19.9
Sector
Power
EBITDA margin (%)
26.0
25.1
25.2
Market Cap (` cr)
115,560
PAT
2,385
2,426
(1.7)
2,361
1.0
Net Debt (` cr)
126,479
Source: Company, Angel Research
Beta
0 .6
52 Week High / Low
180/135
For 3QFY2019, the company posted robust sales growth of 16.1% yoy to end the
Avg. Daily Volum e
439,496
Face Value (`)
10
period at `24,120cr On the Operating front, EBITDA margins came in at 26.0% v/s
BSE Sensex
36,469
25.2% in 3QFY2018. However, inspite of the same PAT came in at `2,385cr v/s.
Nifty
10,894
`2,361cr in 3QFY2018, a rise of 1.0% yoy.; mainly on back of as higher working
Reuters Code
NTPC.BO
capital which impacted the company’s other income and rise in interest expenses.
Bloom berg Code
NTPC.IN
We maintain our Buy.
Shareholding Pattern (%)
Prom oters
58.9
Quarterly highlights: For 3QFY2019, the company posted robust sales growth of
MF / Banks / Indian Fls
27.2
16.1% yoy to end the period at `24,120cr. On an operational basis, gross generation
FII / NRIs / OCBs
11.7
grew 3.4% at ~70 billion units (BUs) whereas energy sold grew 3.1% YoY to 65.3 Bus.
Indian Public / Others
2 .2
PLFs of coal plants were at 77.7% vs. 76.9% in 3QFY18. Thus, higher realizations
(9.6% yoy rise) were key growth driver during the period. On the Operating front,
Abs .(%)
3m
1 yr
3 yr
Sensex
(0.2)
1 .6
46.9
EBITDA margins came in at 26.0% v/s 25.2% in 3QFY2018. However, inspite of the
NTPC
(17.1)
(17.1)
0 .1
same PAT came in at `2,385cr v/s. `2,361cr in 3QFY2018, a rise of 1.0% yoy.; mainly
on back of as higher working capital which impacted the company’s other income,
which dipped by 40% yoy. Interest cost rose 19.9% yoy to `1,277cr, as working
capital increased due to higher receivables. In addition, the tax outgo during the
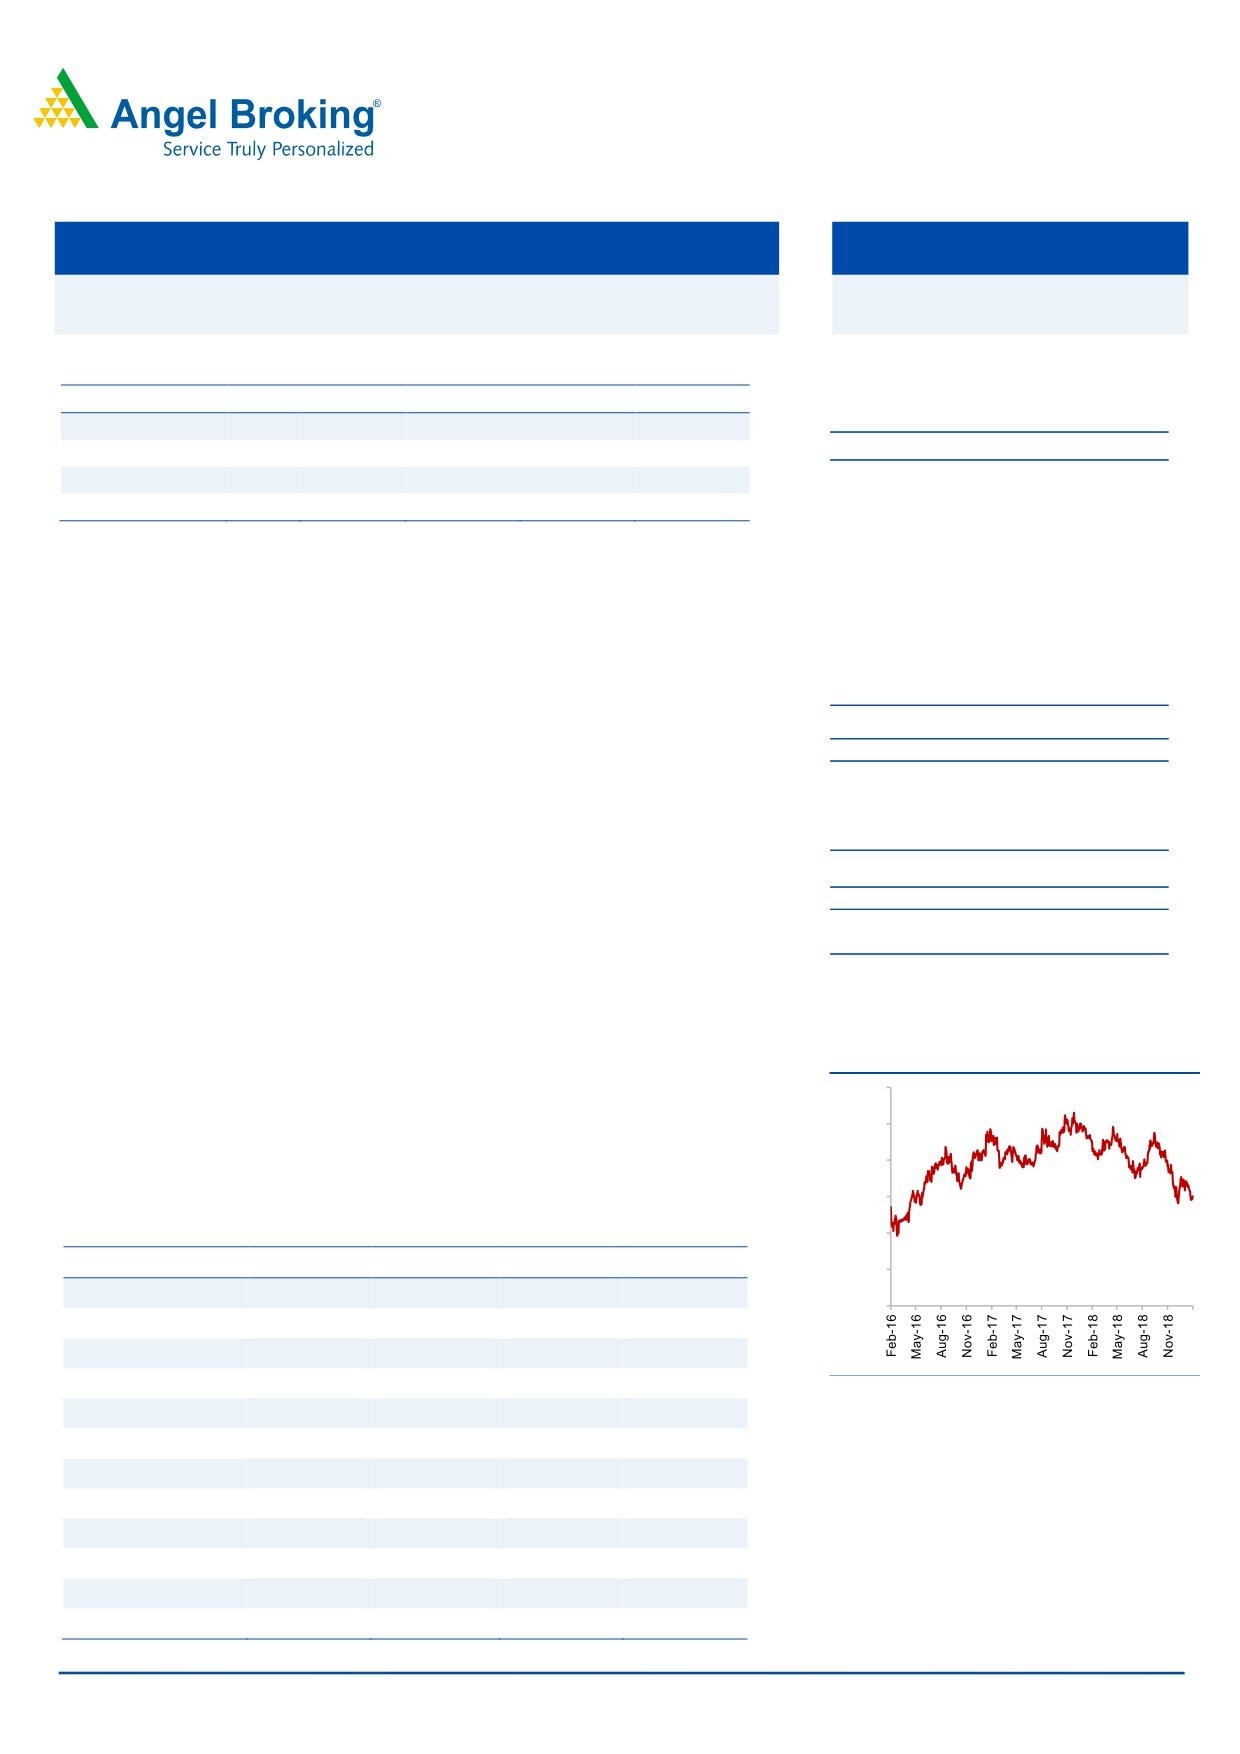
3-year price chart
period was `794cr, a yoy growth of 235.6%.
200
Outlook and valuation: Over FY2018-20, the company is expected to post a CAGR
180
of 10.5% and 10.2% in the sales and net profit respectively. At current price, the
160
stock trades at 1.0xBV FY2019E; which implies a very low ~14-15% business ROE’s
140
and low growth prospects for the company over a long period.
Key financials (Consolidated)
120
Y/E March (` cr)
FY2017
FY2018E
FY2019E
FY2020E
100
Net sales
82,042
88,083
96,011
107,532
80
% chg
11.7
7.4
9.0
12.0
Net profit
10,749
10,526
10,938
12,779
% chg
(1.4)
(2.1)
3.9
16.8
Source: Company, Angel Research
EBITDA margin (%)
26.2
25.4
25.5
25.7
EPS (`)
13.0
12.8
13.3
15.5
P/E (x)
10.7
11.0
10.6
9.0
P/BV (x)
1.2
1.1
1.0
1.0
RoE (%)
11.3
10.5
10.2
11.0
7.4
6.5
6.6
7.2
Sarabjit kour Nangra
RoCE (%)
+91 22 3935 7800 Ext: 6806
EV/Sales (x)
2.8
2.8
2.7
2.2
EV/EBITDA (x)
10.8
11.0
10.5
8.7
Source: Company, Angel Research; Note: CMP as of February 1, 2019
Please refer to important disclosures at the end of this report
1
NTPC Ltd | 3QFY2019 Result Update
Exhibit 1: 3QFY2019 performance (Standalone)
Y/E March (` cr)
3QFY19
2QFY19 % chg (qoq)
3QFY18
% chg (yoy)
9MFY19
9MFY18
% chg(yoy)
Net sales
24,120
22,261
8.4
20,774
16.1
69,085
60,352
14.5
Other income
188
595
(68.5)
313
(40.1)
769
1560
(50.7)
Total income
24,308
22,856
6.4
21,088
15.3
69,854
61,912
12.8
Gross profit
8898
8775
1.4
7981
11.5
26578
23822
11.6
Gross margin (%)
36.9
39.4
38.4
38.5
39.5
Operating profit
6270
5592
12.1
5230
19.9
18127
15757
15.0
Operating margin (%)
26.0
25.1
25.2
26.2
26.1
Financial cost
1277
1294
(1.3)
1065
19.9
3791
2880
31.6
Depreciation
2001
1888
6.0
1881
6.4
5750
5164
11.3
PBT
3180
3005
5.8
2597
22.4
9355
9273
0.9
Provision for taxation
794
579
237
235.6
1956
1855
5.4
PAT Before Exc. And MI
2385
2426
(1.7)
2361
1.0
7400
7418
(0.2)
Minority
0
0
0
0
0
-
Exceptional
0
0
0
0
0
profit/(loss)
Reported PAT
2385
2426
(1.7)
2361
1.0
7400
7418
(0.2)
Adjusted PAT
2385
2426
(1.7)
2361
1.0
7400
7418
(0.2)
Adj. EPS (`)
2.89
2.94
2.86
8.97
9.00
Source: Company, Angel Research
Operational Highlights
Six stations clocked PLF > 85%; while three stations clocked >90% PLF.
Working capital increased due to higher dues/receivables from state
discoms and advance to Railways for preferential rake allotment.
Fixed charge u/recoveries came in at ~`280cr in 3QFY2019. Management
guided for a decline in u/recoveries to ~`750cr in FY2019 v/s ~`1035cr in
9MFY2019, given the improvement in coal availability and the restart of
Unchahar unit 6 (500MW).
Commercial capacity expanded
~323MW yoy to
51.7GW, given
decommissioning of Badarpur (705MW), partly offset by the acquisition
of Barauni (220MW).
Installed Capacity of the group expanded to 53.16GW, a yoy expansion of
~1.8GW. Including the decommissioning of Badarpur (705MW), the
expansion in capacity was around ~2.5GW.
FY2019 capacity addition target maintained at ~4.8GW.
February 2, 2019
2
NTPC Ltd | 3QFY2019 Result Update
Investment arguments
Electricity Sector; woes still hard to Ignore: Though government has allowed
private participation in the sector, private sector has not been able to dent the space;
given most of them are not profitable and have done heavy bidding. While the
demand is likely to improve over next 5 years and new supplies are moderating still
we believe that the PLF’s of the industry will rise moderately; with a downward risk.
Thus, we believe that while possibly the major negativity could be behind us, it is
unlikely that the industry will be out of woods soon.
NTPC; safe haven to take exposure; given its competitive advantages: NTPC is
the largest pan India power generator in the country, having significant market share
in terms of installed capacity as well has in terms of the electricity sold. Unlike its
private players, NTPC's projects operate under the regulated ROE model.CERC
regulations ensure that power generators enjoy a fixed return of 15.5 per cent, under
the regulated ROE model. Along with this NTPC is a cost competitive power producer,
this along with the AFS and strong backing of government; which keeps its cash flow
healthy and access to low cost funds, provides NTPC a safe player in the Industry
struggling with poor business economics. In addition, valuations at 1.0xBV FY2019,
factor in a low business ROE of 14-15% & low growth prospects.
Outlook & Valuation
Over FY2018-20, the company is expected to post a CAGR of 10.5% and 10.2% in the
sales and net profit respectively. Apart from the near term triggers, we believe that the
long term NTPC is well placed to tap the opportunity in the Industry; mainly on back
of the competitive advantage sit enjoy. At current price, the stock trades at 1.0xBV
FY2019E; which implies a very low ~14-15% business ROE’s and low growth prospects
for the company over a long period. On a very conservative basis, giving 1.5xBV to
the regulated book, the target price on the stock will work out to be `195.10-
year trailing P/BV multiple of the company has been at 1.7x.
Company Background
Government of India (GoI) incorporated NTPC in 1975 as a thermal power generation
company. Power generation and bulk sale of electricity forms NTPC's principal
business, and power is sold through long-term PPAs, mainly signed with state
distribution utilities. The company has installed capacity of 50.5GW (including joint
ventures and subsidiaries) as on March 31, 2017 represented around 15% of India’s
capacity and ~24% of the power produced. Coal-based capacities dominate the fuel
mix of NTPC group- of the total installed capacity around 85% capacity is coal-based,
while the balance is based on gas, hydro and renewable projects. The company has
undertaken backward and forward integration and has entered into related
businesses, such as consultancy, coal mining and power trading.
February 2, 2019
3
NTPC Ltd | 3QFY2019 Result Update
Research Team Tel: 022 - 39357800
DISCLAIMER
Angel Broking Limited (hereinafter referred to as “Angel”) is a registered Member of National Stock Exchange of India Limited,
Bombay Stock Exchange Limited, Metropolitan Stock Exchange Limited, Multi Commodity Exchange of India Ltd and National
Commodity & Derivatives Exchange Ltd It is also registered as a Depository Participant with CDSL and Portfolio Manager and
Investment Adviser with SEBI. It also has registration with AMFI as a Mutual Fund Distributor. Angel Broking Limited is a registered
entity with SEBI for Research Analyst in terms of SEBI (Research Analyst) Regulations, 2014 vide registration number INH000000164.
Angel or its associates has not been debarred/ suspended by SEBI or any other regulatory authority for accessing /dealing in
securities Market. Angel or its associates/analyst has not received any compensation / managed or co-managed public offering of
securities of the company covered by Analyst during the past twelve months.
This document is solely for the personal information of the recipient, and must not be singularly used as the basis of any investment
decision. Nothing in this document should be construed as investment or financial advice. Each recipient of this document should
make such investigations as they deem necessary to arrive at an independent evaluation of an investment in the securities of the
companies referred to in this document (including the merits and risks involved), and should consult their own advisors to determine
the merits and risks of such an investment.
Reports based on technical and derivative analysis center on studying charts of a stock's price movement, outstanding positions and
trading volume, as opposed to focusing on a company's fundamentals and, as such, may not match with a report on a company's
fundamentals. Investors are advised to refer the Fundamental and Technical Research Reports available on our website to evaluate
the contrary view, if any
The information in this document has been printed on the basis of publicly available information, internal data and other reliable
sources believed to be true, but we do not represent that it is accurate or complete and it should not be relied on as such, as this
document is for general guidance only. Angel Broking Limited or any of its affiliates/ group companies shall not be in any way
responsible for any loss or damage that may arise to any person from any inadvertent error in the information contained in this
report. Angel Broking Limited has not independently verified all the information contained within this document. Accordingly, we
cannot testify, nor make any representation or warranty, express or implied, to the accuracy, contents or data contained within this
document. While Angel Broking Limited endeavors to update on a reasonable basis the information discussed in this material, there
may be regulatory, compliance, or other reasons that prevent us from doing so.
This document is being supplied to you solely for your information, and its contents, information or data may not be reproduced,
redistributed or passed on, directly or indirectly.
Neither Angel Broking Limited, nor its directors, employees or affiliates shall be liable for any loss or damage that may arise from or
in connection with the use of this information.
Disclosure of Interest Statement
NTPC Ltd
1. Financial interest of research analyst or Angel or his Associate or his relative
No
2. Ownership of 1% or more of the stock by research analyst or Angel or associates or
No
relatives
3. Served as an officer, director or employee of the company covered under Research
No
4. Broking relationship with company covered under Research
No
Ratings (Based on expected returns
Buy (> 15%)
Accumulate (5% to 15%)
Neutral (-5 to 5%)
over 12 months investment period):
Reduce (-5% to -15%)
Sell (< -15)
February 2, 2019
4